• The SH Membership has gone live. Only SH Members have access to post in the classifieds. All members can view the classifieds. Starting in 2020 only SH Members will be admitted to the annual hunting contest. Current members will need to follow these steps to upgrade: 1. Click on your username 2. Click on Account upgrades 3. Choose SH Member and purchase.
  • We've been working hard the past few weeks to come up with some big changes to our vendor policies to meet the changing needs of our community. Please see the new vendor rules here: Vendor Access Area Rules

Nutterbuster Spreads(sheets) It Wide Open

We have the best hunting anyone here has ever experienced but it's no Iowa. You can overlay the P&Y maps over soil fertility and it's darned near a perfect match.
Every state I've looked at is the same. Take the soil map, overlay the light pollution map, and the areas where the people are scarce and the dirt is rich are the 80/20 counties. As in 20% or less acres are accounting for 80% or more of the big bucks.

But...you know...for sure folks should focus more effort on buying the right gear and figuring out all about bedding behavior on the leeward side of ridges and stuff.
An additional useful analysis in this regard would be taking or identifying how much of that 20% is on public hunting ground.
 
I'm going to call your analysis "Nutter Forge." I like it!!!
 
An additional useful analysis in this regard would be taking or identifying how much of that 20% is on public hunting ground.
Not hard to do. Find the good County. Find out if the soil map indicates whether all or just some of that county has the good dirt. Then do a little digging to see if there is public land in that county or part of that county.
 
Interesting to see how good the hunting is in New Jersey & Maryland - significantly better than their neighboring states.

So are you moving the bucket contest to WI so all the mobile hunters can plunder their season filling non-resident tags? Archery/crossbow season there opens September 18th! Could be interesting ... host a Bucketpalooza at the campground nearest the best county & public land...
 
I'll try to refrain from saying what I think are sleeper states for fear of people finding out where I live and lynching me when out-of-state trucks show up at the local WMA.

Kansas, Nebraska, and Texas aren't on the list because I pulled data on every state east of or bordering the Mississippi. Had to draw the line somewhere.

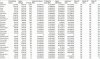
@MSbowhunter48 don't be coy with me sir. Mississippi has 300% more bucks on record and 33% fewer hunters. Plus a pretty significant difference between average trophy sizes in the state. All us Alabama boys are about to come shoot y'all's deer!!

For real though, I've done county-by-county analyses of each state. There's a huge variance between the best and worst counties, and honestly most counties in each state are dismal. 0 popers on record. Maybe 10% of each state has decent to very-good hunting. The best Mississippi county is, by the numbers, something like 10 times better than the best Alabama county.

This is the case for a lot of middle-of-the-road or poor states. One area makes the area look better than it is, or a guy with a lease in one county is practically hunting a different world when it comes to opportunity.

Anybody interested in seeing county-by-county breakdowns of a couple states? Maybe one each from the southeast, midwest, east coast, and northeast?

Fair warning before you get in the bus with the "Free Kandy" graffitti. I'm generously sharing this data to hammer home my theory that the difference between smart deer and dumb deer, or good hunters and bad hunters, pales in comparison to the difference between good hunting grounds and bad hunting grounds.
Lol well to back up your theory, there’s about 3-4 counties in the whole state of MS that are recording “most” of those P&Y bucks. So I would agree with what you’re saying here, I travel 3-4 hours in state just to get to better hunting ground.
 
While the data is certainly interesting and appreciate it. I do believe that there is a lot of information missing in terms of entries. Now, if that missing information is relatively the same accross the board then it really isn't a big deal. There really just is no way to know if that is the case or not. 1444 P&Y typical entries since 1908 is so far off that it's not even funny in comparison to the number of P&Y taken. Just my 2 cents but interesting data and interesting conversation. Can't kill em if they ain't there is the theme.
 
That's also helpful if you're considering hunting there as far as how crowded the woods are. WI looks great as people per sq mile, but looks horrible when you look at hunters per sq mile. Driving through WI during rifle season is actually a little scary. There are orange hunters literally everywhere along the interstate.
 
Looks like IN might be a sleeper state. Also, if you want to hunt IA, you need to plan that out 3-4 years ahead of time. That's how long it will take you to draw a non-resident tag.

Sent from my SM-G930V using Tapatalk
 
Let me see if I can get this right.

Population is human population and based on USDA 2019 population estimation. Square mileage is also based on current USDA info. P&Y numbers all obviously pulled from their database. The P&Y number reflects every typical whitetail recorded in that state from last year back to 1908. The mean, median, and mode are all based on the most recent 100 animals harvested in each state except in cases where there were less than 100 deer (looking at you, Vermont). In that case I used all of them. I didn't calculate those figures based on the full data set because holy-crap-are-you-kidding-me-that's-a-lot-of-deer-Wisconsin.


Feel free to download and share and whatever for free*.

*by free I mean you will all pay by enduring me pointing out to every Infalt nut dangler that he lives in a state where a P&Y typical has been harvested for every 5 square miles of land, and just general midwest bias smashing in general. You'll also owe me one "wonder why THP never came back to Alabama" comment per times the spreadsheet is viewed.

Also, everybody please keep @Vtbow and his compatriots in Vermont in your prayers. They're fighting the good fight up there. We stan with the Florida boys too. Indiana, Wisconsin, and Illinois members feel free to never talk about how hard deer hunting is to anybody ever again. :)

Why did I do this? Because I had 2 hours to spare and I've done county-by-county analysis for my state and a few others so this wasn't that hard and I've never seen it before.

In all seriousness, hope it's interesting and useful. Feel free to let me know if there's something else that might can be added to it to make it more valuable. I withhold the right to say bugger off, but if it's interesting and useful to me too it'll probably happen.
Just gotta say, I grew up hunting public and private just down the road from @Nutterbuster and his comments about the Midwest are correct. I moved to Wisconsin last year. Here I’ve hunted almost exclusively on public about 20 minutes from a large population center (read high pressure) and the deer hunting here has been better than the best private lands in the Deep South.

With that said, out of state folks should focus on KY, OH, IL, and IN.
 
If only Iowa had more trees, I feel we could really move up the list. Until then, I'll have to settle for third.

This data makes me want to actually consider trophy hunting. I'm more of fill the freezer as quickly as possible kinda guy. Maybe that will change when my boys are grown and free time exists...


Edit: thanks for putting this together @Nutterbuster . It's fascinating to actually see the numbers.
IA is almost the ideal but now they know it and they are still managing their huge bucks properly and hiking up license fees and limiting permits to keep the resource a hot commodity. Can't blame them. Wish I was a resident. I don't even consider it as everything I've heard its very hard to get an out of state tag there anyway. OTC, low population, low hunter density, reasonable PY entries and then soil health are reasonable macro parameters to consider. Drilling down to a more micro perspective... the four "R's are what to look for, Roads, Rivers, Ridges, Rows (of crops, diversion ditches, sloughs, two tracks etc. and their convergence the "walls" if you will of directing deer traffic in decent terrain on low pressure public ground.
 
Delaware is alot better than those numbers indicate. Multiple P&Y deer around here. Barely blink at the 144 ave. We have Booners.


But by all means, leave us alone...lol.
 
This thread motivated me to do a check of my home state (NY) buck take and overall deer take based on county from the 2020 season and boy was that an eye opener!

Of the two counties I hunt in, one is ranked the lowest in buck take and second lowest in overall deer take, the other placed 15th and 14th lowest in those same categories out of 56 counties. Needless to say I am relocating my efforts this year to much greener pastures!!

The only thing that saved me from getting sick and throwing up on the keyboard at that moment was the realization that I've been consistently pulling deer each year from these bleak counties since 2005 so I must be doing something right and could actually be a good hunter.
 
Since there seems to be an interest:

 
Let me see if I can get this right.

Population is human population and based on USDA 2019 population estimation. Square mileage is also based on current USDA info. P&Y numbers all obviously pulled from their database. The P&Y number reflects every typical whitetail recorded in that state from last year back to 1908. The mean, median, and mode are all based on the most recent 100 animals harvested in each state except in cases where there were less than 100 deer (looking at you, Vermont). In that case I used all of them. I didn't calculate those figures based on the full data set because holy-crap-are-you-kidding-me-that's-a-lot-of-deer-Wisconsin.


Feel free to download and share and whatever for free*.

*by free I mean you will all pay by enduring me pointing out to every Infalt nut dangler that he lives in a state where a P&Y typical has been harvested for every 5 square miles of land, and just general midwest bias smashing in general. You'll also owe me one "wonder why THP never came back to Alabama" comment per times the spreadsheet is viewed.

Also, everybody please keep @Vtbow and his compatriots in Vermont in your prayers. They're fighting the good fight up there. We stan with the Florida boys too. Indiana, Wisconsin, and Illinois members feel free to never talk about how hard deer hunting is to anybody ever again. :)

Why did I do this? Because I had 2 hours to spare and I've done county-by-county analysis for my state and a few others so this wasn't that hard and I've never seen it before.

In all seriousness, hope it's interesting and useful. Feel free to let me know if there's something else that might can be added to it to make it more valuable. I withhold the right to say bugger off, but if it's interesting and useful to me too it'll probably happen.
This is solely the best thing I have read on SH in a while. Quality work.
 
Back
Top