• The SH Membership has gone live. Only SH Members have access to post in the classifieds. All members can view the classifieds. Starting in 2020 only SH Members will be admitted to the annual hunting contest. Current members will need to follow these steps to upgrade: 1. Click on your username 2. Click on Account upgrades 3. Choose SH Member and purchase.
  • We've been working hard the past few weeks to come up with some big changes to our vendor policies to meet the changing needs of our community. Please see the new vendor rules here: Vendor Access Area Rules

How to Hunt By the Numbers

Another thread I need to read through in greater detail later ... @Nutterbuster I wanted to mention that if you're copying data from one excel spreadsheet to another, the function vlookup might help- you'll have a much easier time combining data from different tables. It's a function that says basically if this cell is the same on this table and that table, paste the related data for me automatically. That was a much worse explanation than almost any YouTube vlookup video so I'll stop confusing it.

If you're already doing this my apologies, thought it may help with the number crunching.
 
Told ya we couldn't read or 'rithmetic!

That should read "only about 1 in 4 hunters is harvesting a 3.5yo or better animal." 47 x .59 =27.73. 100 hunters kill 47 deer and 27 of those deer should be 3.5 or better. Again, that's based on DMAP and SOA reporting on prime properties.

Well some of us can LOL
 
Told ya we couldn't read or 'rithmetic!

That should read "only about 1 in 4 hunters is harvesting a 3.5yo or better animal." 47 x .59 =27.73. 100 hunters kill 47 deer and 27 of those deer should be 3.5 or better. Again, that's based on DMAP and SOA reporting on prime properties.
That's a pretty solid success rate. My ancestral DPA is at 15% overall hunter success rate. Closer to where I'm at now overall hunter success rate is in the 40-50% range with half or so of the take antlerless. Some of these areas were manages with APRs which now have been removed (partly due to CWD measures) so I figure the age structure of the take is pretty good around here, but again y'all are shooting more 3.5yos than we do in (much of) the midwest. They're just smaller.
 
The other thing to consider is outside hunters coming into a county to hunt. I would estimate 30% of our hunters are not residents of our county.
 
y'all are shooting more 3.5yos than we do in (much of) the midwest
Again, really hard to speak in absolutes there given our dismal record-keeping. We're only measuring our best properties. Last I heard the state was struggling to get over 100 properties involved in the DMAP (Deer Management Assistance Program) and the only publicly managed properties I've seen collect good harvest data are the SOAs which make up some of the best hunting in the state. 99% of our acreage is not reporting age structure.

I think the P&Y records in this case may be more accurate yardsticks just because it's going to at least be an evenly crappy sample across state lines. But there's truth to what you say about most of our bucks won't be tall enough to ride that ride. Our average P&Y buck is 10" smaller than Wisconsin's and according to the DMP Coordinator the average mature buck will not break 125" in much of the state even if he dies of old age.
 
I agree completely with your results. I believe most of will concede that all areas that have reasonable deer populations will have some sort of population of mature bucks. How those mature bucks will score (P&Y or B&C) compared to other areas depends largely on the resources available to them, i.e. soil composition, food sources. available minerals, etc.

Speaking from my strictly Michigan experience, a mature whitetail buck in northern Michigan is likely to score in the 120-140 in. range. Sure, there are exceptions but they are few and far between. Travel 4 hours south and the mature bucks gain 20-30 in. The pressure isn't necessarily any less, in fact its probably greater but the conditions that support antler growth and development are better.

If I was chasing "inches" I would certainly head further south every deer season. However. my personal goal is to simply pursue the "mature" whitetails in my area, whatever they may score. Whatever the reason, be it simply scarcity or a learned means of hunter avoidance, these animals provide a greater challenge to the hunter. If you can consistently find, target and kill a 120" buck where I hunt you are doing something right.
Agree. This is where I’m headed with my “Average” thread.
Reminds me of out West with the Opportunity tag vs Quality Tag, without having to draw/pay
 
Again, really hard to speak in absolutes there given our dismal record-keeping. We're only measuring our best properties. Last I heard the state was struggling to get over 100 properties involved in the DMAP (Deer Management Assistance Program) and the only publicly managed properties I've seen collect good harvest data are the SOAs which make up some of the best hunting in the state. 99% of our acreage is not reporting age structure.

I think the P&Y records in this case may be more accurate yardsticks just because it's going to at least be an evenly crappy sample across state lines. But there's truth to what you say about most of our bucks won't be tall enough to ride that ride. Our average P&Y buck is 10" smaller than Wisconsin's and according to the DMP Coordinator the average mature buck will not break 125" in much of the state even if he dies of old age.
You're better at recordkeeping than MN is, in any case - and I agree that Pope and Young is pretty clearly the better yardstick to use, if you're after antlers. Given the amount of harvest that states like MN and WI cram into even just opening day and for sure into firearms seasons, and how the regional data averages out (which I imagine smooths out at least some of the sampling oddities, although there can certainly be regional differences as well).

What I can say is that, high-ish deer numbers and high-ish average hunter success (even if the average SE hunter spends 50% more days afield per older QDMA data - they're also taking almost double the bucks/hunter vs. the midwest) with more diffuse hunting pressure and liberal bag limits is definitely a different dynamic than the concentrated pressure, lower overall success, and stricter harvest limits of the midwest.

The average SE hunter spending more days afield, with less of a clock counting down, seems more likely (to me) to have the average joe hunting more selectively than an orange army free-for-all. But I have very little feel for how the occasional, few-times-a-year, southern hunter would operate.

Also interesting to look at are the data on either side of the MN/WI border. definitely some of that is a diiference in landscape that happens to track with the border, but also differences in management. Probably some recordkeeping differences too. Similar to the AL/MS thing only more so and with bigger deer.
1632160826707.png
 
I'll try to add to your Alabama harvest information with something I've recently found. Every year, Alabama Outdoor News puts out some "WMA Specials" with harvest information for both bowhunting and firearms. They pull this info from the various WMA biologists. I wish it was public data WFF put on Outdoor Alabama. If you're willing to pay for a subscription to AON you can search back through several years of issues to build up the data set.
 
You're better at recordkeeping than MN is, in any case - and I agree that Pope and Young is pretty clearly the better yardstick to use, if you're after antlers. Given the amount of harvest that states like MN and WI cram into even just opening day and for sure into firearms seasons, and how the regional data averages out (which I imagine smooths out at least some of the sampling oddities, although there can certainly be regional differences as well).

What I can say is that, high-ish deer numbers and high-ish average hunter success (even if the average SE hunter spends 50% more days afield per older QDMA data - they're also taking almost double the bucks/hunter vs. the midwest) with more diffuse hunting pressure and liberal bag limits is definitely a different dynamic than the concentrated pressure, lower overall success, and stricter harvest limits of the midwest.

The average SE hunter spending more days afield, with less of a clock counting down, seems more likely (to me) to have the average joe hunting more selectively than an orange army free-for-all. But I have very little feel for how the occasional, few-times-a-year, southern hunter would operate.

Also interesting to look at are the data on either side of the MN/WI border. definitely some of that is a diiference in landscape that happens to track with the border, but also differences in management. Probably some recordkeeping differences too. Similar to the AL/MS thing only more so and with bigger deer.
View attachment 52997
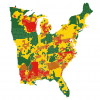
This map is garbage. They are collecting data from the state wildlife agencies. The state wildlife agencies are collecting data from extremely different sample sizes. A red area in one state could be a green area in another because of where and how they are collecting the data.
 
This map is garbage. They are collecting data from the state wildlife agencies. The state wildlife agencies are collecting data from extremely different sample sizes. A red area in one state could be a green area in another because of where and how they are collecting the data.
I wouldn't go as far as garbage. What you're saying is true but there's still some big-picture data you can glean. Florida MAY hold as many deer as Mississippi, but it probably on average doesn't. The map matches up pretty closely to soil types that grow better vegetation and bigger herbivores.

Kinda a bunny trail, but I've always wondered why we don't do drive-by deer herd surveys similar to how we do aerial duck surveys. Drive x amount of miles in an area during a certain timeframe (say 2 hours after sundown and 2 hours before) and count just the deer you see on the right-of-way. Seems like a cheap and straightforward way to get population estimates in a wide variety of habitats.
I'm telling you, that map is nowhere near correct just based on the lack of data control for the sampling sizes. What each state is sampling doesn't have the same base. They aren't measuring the same group types in each state. A much better picture of deer density is something like an automobile collision map.
 
I'm telling you, that map is nowhere near correct just based on the lack of data control for the sampling sizes. What each state is sampling doesn't have the same base. They aren't measuring the same group types in each state. A much better picture of deer density is something like an automobile collision map.
For sure looking across state lines you want to double-check things, but in general the map holds up, for what it is - a starting point.

(It's worth noting that there can be trophy-rich areas with low overall deer density in e.g. agricultural areas) Available cover limits the population, but what's there eats well and thrives. Also the extreme MN/WI border is also borne out in harvests.
1632164992614.png
 
I'm telling you, that map is nowhere near correct just based on the lack of data control for the sampling sizes. What each state is sampling doesn't have the same base. They aren't measuring the same group types in each state. A much better picture of deer density is something like an automobile collision map.
Something like this?

1920_deermap.png

States with big red blobs do have higher deer collisions, and green-blob states seem to have lower collision rates. Arkansas is the weird exception for the southeast.
 
Not a great measure of deer density overall. Possibly a good measure of deer density in concentrated areas. Concentrated large-scale agriculture in particular concentrates deer populations into limited, often poorly-connected pockets so lower population areas can have high collisions sometimes. Road quality, traffic regulations, and amount of traffic in heavy deer areas also come into play.

All just pieces of the puzzle. Certainly some areas don't quite add up (LA, for example) when cross-comparing, but most do.
I drive several states multiple times each year, and the collision map matches up much closer than the NDA's flawed data set. Not only does it match up better in terms of sightings from a vehicle, but also sightings from a stand. I'd much rather go from certain red counties and travel to certain green counties just to see deer.
 
I drive several states multiple times each year, and the collision map matches up much closer than the NDA's flawed data set. Not only does it match up better in terms of sightings from a vehicle, but also sightings from a stand. I'd much rather go from certain red counties and travel to certain green counties just to see deer.
It's not surprising that a map of car-deer collisions matches up with the number of deer that you see while driving in a car. I kinda feel like LA juiced its deer numbers a bit and that's colored your perception of the entire map.
 
@LAKY, all I can say is that the NDA map does very accurately capture Alabama's Black Belt Region, which is a pretty specific feature that also shows up on the trophy buck heat map I made based largely on Alabama Whitetail Record data, the P&Y county map, and a soil type map.
 
Back
Top